Why Traditional SEO Reports Are Failing Your Clients
Let's be real for a moment: those static, monthly PDF reports you're sending to clients? They aren't just getting ignored—they might be doing more harm than good for your client relationships. We've all been there, spending hours exporting data and piecing together spreadsheets, only for our hard work to disappear into a digital void. Clients often find these reports overwhelming, filled with jargon that doesn't connect to what they really care about: their business goals.
The result is predictable. They skim the report, get confused, and start to wonder what they’re actually paying for because the value isn't clear. This disconnect is a huge contributor to client churn. When a client gets a 50-page document full of complex charts, they're hit with data fatigue. Instead of feeling informed, they feel intimidated. A static report is a one-way street when what they really need is a dynamic conversation about their progress.
The Shift from Static Data to Dynamic Stories
This is where a live, interactive SEO dashboard for clients changes everything. It turns your reporting from a historical document into a living, breathing tool that shows off your value in real-time. Instead of dumping data on them, you give clients a curated look at the metrics that actually matter to their success.
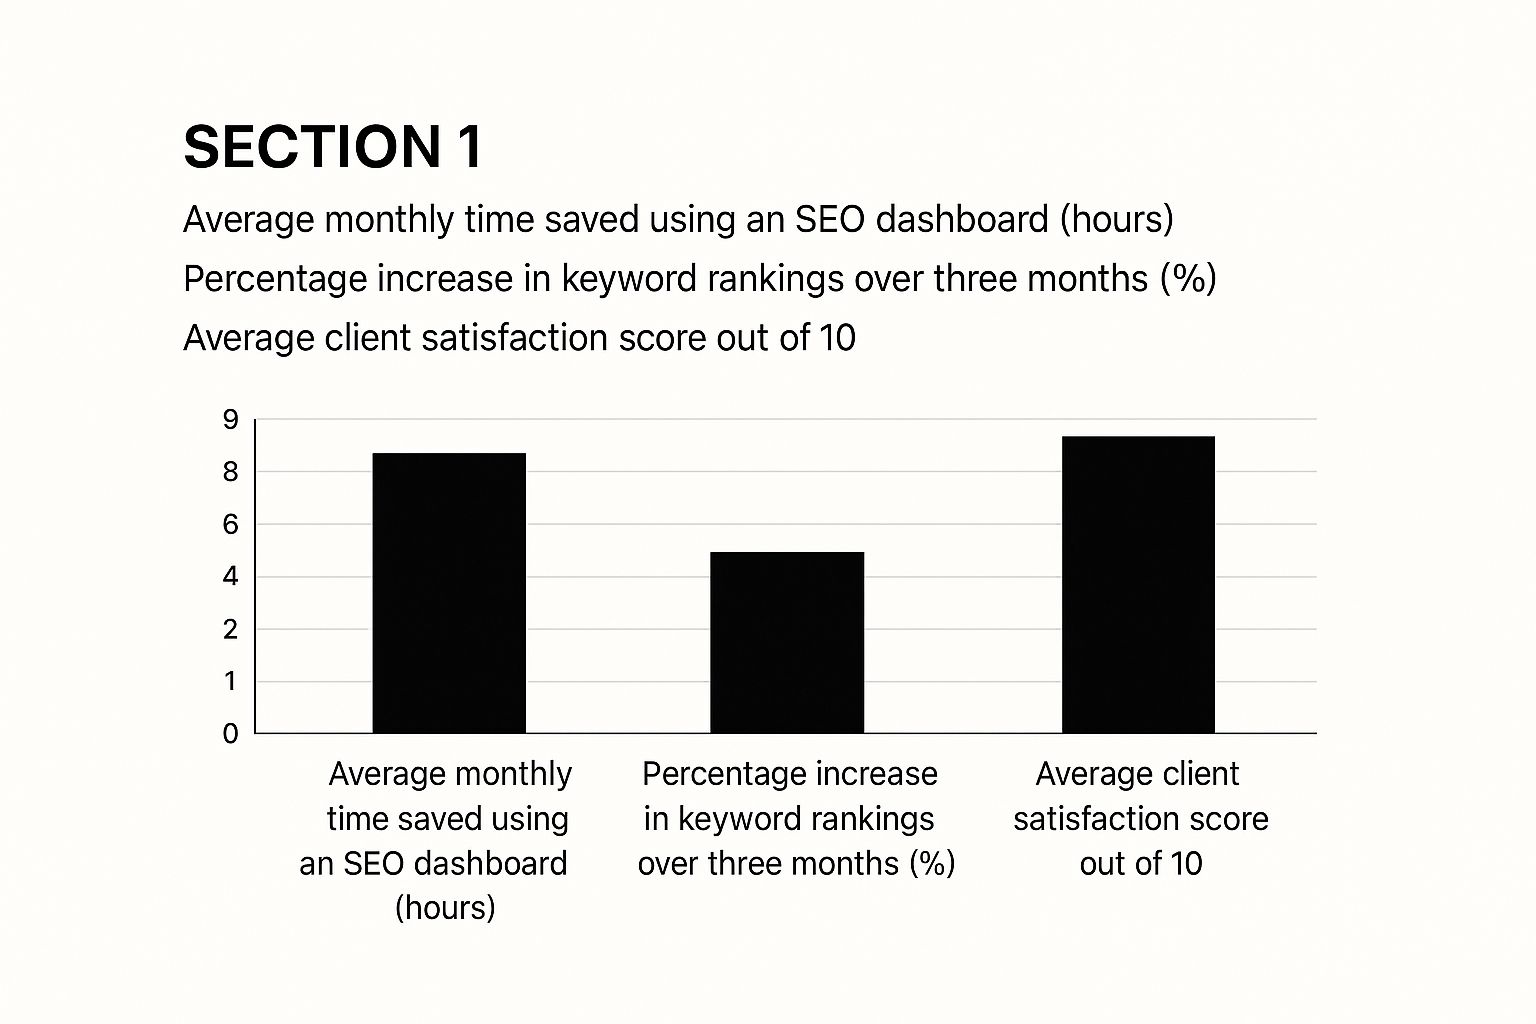
For instance, a modern dashboard can present key information in a way that’s instantly understandable, letting clients see their progress at a glance.

This kind of visual clarity immediately communicates wins, like better keyword rankings or improved site health, without making the client decipher a dense spreadsheet. It's this move toward accessible, transparent reporting that is fueling major growth in the SEO industry. The global market for SEO services is expected to climb from $90.35 billion in 2024 to $194.6 billion by 2029, a jump driven by the demand for clear, measurable results.
Building Trust Through Transparency
The problem with old-school reports isn't the data itself; it's how it's presented. A well-designed dashboard acts as a bridge between the technical work you do and the business outcomes your client wants. To move beyond scattered data, learning how to create a powerful marketing KPI dashboard is key to demonstrating real value.
When you give clients 24/7 access to their campaign's performance, you create a true partnership built on transparency. They no longer have to wait a month to see what's happening; they can log in anytime and see the direct impact of your efforts. This level of access builds incredible trust and transforms your reporting from a monthly chore into a constant confirmation of your agency's worth.
Picking Metrics That Actually Make Clients Say 'Wow'
Moving past the old-school, data-dump style of reporting means shifting your focus from vanity metrics to value metrics. Your client doesn't need to see every single keyword you're tracking. A successful SEO dashboard for clients zeroes in on the data points that directly connect your work to their business objectives. The goal is to provide a clear, concise story of their success, not overwhelm them with charts.
From Technical Jargon to Business KPIs
The real secret is learning to translate your technical SEO wins into the language of business. While your team might be high-fiving over an improved crawl budget, your client is wondering how that actually affects their bottom line. When you're choosing metrics, think about what matters to them. This approach helps bridge the gap between your technical efforts and their financial goals.
The right dashboard doesn't just make reporting easier; it has a tangible impact on agency performance and client relationships. This is something we've seen time and again.
As you can see, a well-designed dashboard doesn't just boost key SEO results—it also leads to major improvements in operational efficiency and client happiness. It's a win-win.
Core Metrics That Demonstrate Real Value
To create those "wow" moments for your clients, build your dashboard around a few core categories that resonate with business owners and executives. Here are the areas I always prioritize:
- Organic Visibility and Traffic Growth: This is the foundation of your SEO story. Of course, you need to show the upward trend in organic sessions from a tool like Google Analytics. But take it a step further. Highlight traffic growth to their "money pages"—the product, service, and lead-gen pages that directly contribute to revenue. This is non-negotiable, especially since organic search accounts for about 94% of all clicks. With a staggering 99,000 Google searches happening every second, proving your impact in this channel is essential. You can find more details on these powerful SEO statistics and their implications.
- Conversion and Goal Completions: This is where you directly connect SEO to ROI. Tracking organic-driven conversions—whether that's form submissions, phone calls, or e-commerce sales—is what truly matters. Telling a client your keyword strategy led to a 20% increase in qualified leads is far more powerful than simply showing them ranking improvements. This metric turns your efforts into tangible business results.
- High-Intent Keyword Movement: Instead of flooding the report with hundreds of keywords, focus on a curated list of high-commercial-intent terms. Show progress on the keywords people use when they're ready to buy. For a local business, seeing their brand climb the SERPs for "emergency plumbing services near me" will always be more impressive than a rank jump for a low-value informational keyword.
To help you tailor your reports, here's a table that breaks down which metrics are most important for different types of clients.
Essential Client Dashboard Metrics by Business Type
Comparison of key metrics to track based on different client industry types and business models
| Business Type | Primary Metrics | Secondary Metrics | Reporting Frequency |
|---|---|---|---|
| Local Service Business (e.g., Plumber, HVAC) | Google Business Profile Views & Clicks, Local Pack Rankings, Phone Call & Form Conversions, "Near Me" Keyword Rankings | Organic Traffic to Service Pages, Overall Keyword Visibility, Review Count & Rating | Bi-Weekly or Monthly |
| E-commerce Store (e.g., Online Retailer) | Organic Revenue, Organic Transactions, Product Page Traffic, Category Keyword Rankings | Shopping Cart Abandonment Rate (Organic), Average Order Value (Organic), New vs. Returning Customers | Weekly or Bi-Weekly |
| SaaS Company (e.g., Software Provider) | Demo Requests/Free Trial Sign-ups (Organic), "Alternative" & "Vs" Keyword Rankings, Organic Lead-to-Customer Rate | Blog/Resource Traffic, Branded vs. Non-Branded Traffic, Time on Page for Key Features | Monthly |
| B2B Lead Gen (e.g., Consulting, Agency) | MQLs/SQLs from Organic, Whitepaper/Ebook Downloads, High-Intent Keyword Rankings (e.g., "services," "provider") | Traffic to Case Studies/Portfolio, Cost Per Lead (Organic), Top Performing Content | Monthly |
This table shows how you can customize your reporting to speak directly to what each client values most, whether it's local leads or online sales. By aligning metrics with business models, you make your reports more relevant and your value much clearer.
Building Dashboards That Tell Compelling Success Stories
Once you've figured out which metrics to track, the next step is designing the dashboard itself. A great SEO dashboard for clients is more than just a place to dump data; it's a visual story that clearly shows them the progress you're making. A messy or confusing dashboard can completely undercut even the best results. We need to borrow a few principles from UX design to create something that feels intuitive and reinforces the value you bring to the table.
Think about it: a cluttered layout with jarring colors is like shouting a bunch of random numbers at your client. It’s overwhelming and makes them tune out. On the other hand, thoughtful design builds trust. It uses visual hierarchy, smart color choices, and whitespace to guide their eyes to the biggest wins. A good dashboard doesn't just show a traffic increase; it makes that trend line the star of the show.
Crafting a Clear Visual Hierarchy
Visual hierarchy is all about arranging things so the user naturally sees the most important information first. Your client should be able to glance at their dashboard and understand the main takeaway in less than five seconds.
Here’s how you can achieve that:
- Size and Prominence: Your most important KPIs, like organic conversions or revenue, should be the biggest, boldest elements on the page.
- Color and Contrast: Use a specific brand color to highlight positive trends (like green for growth) and keep the rest of the data in a more neutral palette. This immediately flags success.
- Strategic Whitespace: Don't try to cram every widget and chart together. Giving elements room to breathe makes the dashboard feel cleaner, more professional, and much easier to read.
This is a fantastic example of a clean layout that makes even complex data easy to understand at a glance.
See how the main performance metrics are displayed clearly right at the top? The charts below offer more detail without cluttering the main view.
When you're managing reports for many clients, using specialized SEO software for agencies is a game-changer for building these kinds of dashboards efficiently. These platforms usually come with pre-built templates that already follow these design best practices. If you're interested in building one from scratch, you can check out our detailed guide on creating an effective SEO client dashboard. By focusing on visual storytelling, you turn a simple report into a powerful tool that consistently proves your agency's value.
Automating Reports That Feel Personal and Thoughtful
Swapping manual reporting for automation is a massive productivity win, but let’s be honest: nobody wants to get a cold, robotic email that screams "sent by a machine." The real art of a great automated SEO dashboard for clients is finding that sweet spot between efficiency and a personal touch. Your goal is to build a system that delivers timely insights while still feeling like a thoughtful update from a trusted partner. This is where modern dashboarding platforms go beyond simple data dumps and become powerful communication tools.
The demand for these advanced reporting capabilities is exploding, which points to a major shift in our industry. The market for SEO software, the engine behind these client dashboards, is projected to jump from $84.94 billion in 2025 to an incredible $265.91 billion by 2034. This growth shows just how much agencies now rely on sophisticated tools to prove their value. You can dig into the details by reading the full analysis on the drivers behind this rapid market expansion. The takeaway is clear: clients expect more than just raw data; they want accessible, meaningful insights.
Finding the Right Reporting Rhythm
One of the first questions I always get is, "How often should I send these reports?" If you send them too often, you risk your emails being ignored. Too infrequently, and clients start feeling like they're in the dark. The right cadence is all about the specific client and where they are in their campaign journey. For a deeper dive, check out our guide on how to create SEO reports that clients actually read.
Think about it in terms of these scenarios:
- New Campaigns or High-Growth Phases: During the first three to six months of a new campaign, or when performance is changing quickly, a bi-weekly automated summary works wonders. It keeps the client looped in and excited about the early wins.
- Stable, Mature Campaigns: For your long-term clients with steady, predictable performance, a monthly automated report is usually perfect. It acts as a consistent check-in that confirms the strategy is working without cluttering their inbox.
- E-commerce or Fast-Paced Industries: Clients in competitive spaces like e-commerce often need more frequent updates. A weekly snapshot focusing on key revenue-driving metrics can give them the near-real-time data they need to make quick decisions.
To help you decide, here’s a breakdown of reporting schedules I’ve found work best for different types of clients and campaigns. This table should give you a solid starting point for creating a rhythm that keeps everyone happy and informed.
| Client Type | Dashboard Updates | Detailed Reports | Strategy Reviews |
|---|---|---|---|
| New Client (First 6 Months) | Real-time / Daily | Bi-Weekly Summary | Monthly Call |
| Established SMB Client | Weekly | Monthly Full Report | Quarterly |
| Large Enterprise | Real-time with Custom Views | Monthly & Quarterly | Quarterly & Annually |
| E-commerce Store | Daily / Real-time | Weekly Performance | Bi-Weekly or Monthly |
| Local Service Business | Weekly | Monthly Snapshot | Quarterly |
This table provides a great framework, but always remember to discuss reporting frequency with your client during onboarding. Setting expectations early prevents misunderstandings later and ensures the reporting schedule adds value instead of just creating noise.
Configuring Smart, Actionable Alerts
Scheduled reports are just one piece of the puzzle. You can really show you're on top of things by setting up intelligent alerts that notify both you and the client when something significant happens. This proactive approach reinforces that you're actively managing their account, not just letting the software do all the work.
I recommend setting up alerts for things like:
- A major ranking drop for a top-tier keyword.
- A sudden, unexpected spike in organic traffic.
- Hitting a key performance milestone, like a new monthly traffic record.
These automated, yet perfectly timed, notifications create a sense of active management and personal oversight that clients really appreciate. It turns the dashboard from a passive reporting tool into an active watchdog for their business.
Mastering White-Label Branding That Screams Professionalism
An automated reporting system is a massive improvement, but the real hallmark of a top-tier agency lies in the presentation. When you provide an SEO dashboard for clients, every single element should reinforce your brand, not the software you happen to be using. White-labeling is what turns a generic tool into a branded, professional client portal that feels like a natural part of your agency. This isn't just about making things look pretty; it's a smart way to build brand equity and client loyalty with every login.
Your ability to customize the dashboard is a huge differentiator. It shows you've invested in a quality solution and are committed to creating a seamless experience. Think about it: your client logs into a portal with your logo, your agency’s color scheme, and is hosted on a custom domain like reports.youragency.com. This instantly changes their perception of your service from a simple retainer to a fully integrated partnership.
Essential White-Label Customizations
To nail this cohesive brand experience, you'll want to focus on a few key customization features. These are the details that separate a DIY setup from a polished, professional one:
- Custom Domain (CNAME): This is the undisputed champion of white-labeling. It lets you host the dashboard on your own subdomain, completely erasing any mention of the software provider’s URL. It's the most powerful way to make the platform feel like your own proprietary tech.
- Logo and Favicon: Your agency’s logo needs to be the first thing clients see on the login page and a constant presence within the main interface. Don’t overlook the favicon—that little icon in the browser tab—as it's the finishing touch that completes the branded look.
- Color Scheme Integration: Apply your brand’s primary and secondary colors throughout the dashboard’s interface. Consistent coloring across your website, proposals, and now your reporting dashboard creates a strong, unified brand identity that builds subconscious trust.
This screenshot from That’s Rank! shows just how easy it is to upload your logo and set a custom color scheme, instantly making the entire interface your own.

As you can see, with just a couple of clicks, the dashboard takes on the agency's visual identity. This guarantees a consistent and professional experience every time a client logs in.
Extending Your Brand Beyond the Dashboard
Your branding work shouldn't end at the dashboard's login screen. A truly professional setup ensures every single client touchpoint is consistent. This means customizing automated email notifications and PDF exports with your logo and brand colors, too.
When a client gets an alert or downloads a report, it should look and feel like it came directly from your team. This attention to detail turns routine communications into subtle but effective marketing opportunities that constantly reinforce your agency's value and professionalism.
Turning Client Questions Into Trust-Building Opportunities
Even with the clearest SEO dashboard for clients, questions are going to pop up. A client might message you asking, "Why did our organic traffic dip this week?" or "What does this 'bounce rate' number really mean for my business?" How you field these questions is a defining moment for your agency. You can either create confusion and doubt or build unshakeable trust by showing off your expertise. The best agencies treat every question as a chance to educate, not just to answer.
The Art of the Proactive Walkthrough
Don't just email over the login details and call it a day. The single best way to cut down on future confusion is to schedule a detailed dashboard training session from the very beginning. Whether it's a screen-share call or an in-person meeting, take them through every widget and metric you've included.
The key is to connect everything back to their specific business goals. Instead of just pointing to a graph and saying "This is your conversions," try this: "This chart right here shows us how many new leads our recent blog content is generating for your sales team each month." This small shift in framing makes a world of difference.
This proactive approach does two important things: it demystifies the data for the client and solidifies your role as their strategic partner. It also lays the groundwork for more productive future conversations, shifting your regular check-in calls from defining basic terms to discussing high-level strategy.
Framing Answers That Build Confidence
When those inevitable questions do come up, resist the urge to get bogged down in technical SEO jargon. Your client doesn't need a deep dive into Google's latest algorithm update; they need to know what it means for their bottom line. Using simple analogies is a great way to make complex ideas stick.
- For a rankings drop: "Think of keyword rankings like lanes on a busy highway. Sometimes, a new competitor merges in, causing a temporary slowdown for everyone. Our job is to find a faster, clearer lane, which is exactly what our new content strategy is designed to do."
- For a traffic spike: "This jump in visitors is fantastic. It's like we put a bigger, brighter sign outside your physical store, and now more people are coming in to browse. Our next step is to focus on turning these window shoppers into paying customers."
By translating SEO concepts into relatable scenarios, you empower your clients. They feel more involved in the process and more confident in your strategy. This turns a potentially stressful Q&A into a collaborative, trust-building conversation, making your dashboard much more than a reporting tool—it becomes a shared platform for achieving success.
Measuring Dashboard Success and Continuous Improvement
A great SEO dashboard for clients isn’t a "set it and forget it" tool; it's a living asset that should grow alongside your client's business. Getting the dashboard launched is really just the first step. The real value comes from measuring its effectiveness and using what you learn from clients to make it even better. This cycle of improvement is what truly sets top-tier agencies apart, transforming your dashboard from a simple reporting tool into a vital part of your client relationship.
So, how can you tell if your dashboard is actually doing its job? It’s less about the raw data it shows and more about how your clients are actually interacting with it.
Key Indicators of Dashboard Performance
To figure out if your dashboard is hitting the mark, you need to look past the SEO metrics themselves and focus on how your clients engage with the tool. Here are the main things I always keep an eye on:
- Client Login Frequency: Are clients popping in to check on their progress without you prompting them? A high login rate, especially outside of your scheduled meetings, is a fantastic sign. It means they see the value and find it easy to use. If logins are sparse, it could mean the dashboard is too cluttered or isn't highlighting the metrics they truly care about.
- Time Spent on Dashboard: When they do log in, are they just giving it a quick glance before bouncing? Or are they spending time clicking through different reports and digging into the data? Longer session times suggest they're engaged and genuinely curious about the performance story you're telling.
- Reduced "Basic" Questions: A well-designed dashboard should answer the most common client questions before they even have to ask. If you start seeing fewer emails asking, "How's our traffic this month?" or "Are our keyword rankings improving?", you know the dashboard is working as intended.
The Feedback Loop: Auditing and Iterating
Watching usage stats is great, but you also need to be direct and ask for feedback. I find that setting up a quick quarterly "dashboard review" call with clients is incredibly effective. Ask them what they find most helpful and what just feels like noise. Their perspective is invaluable.
This feedback, paired with the engagement data you're tracking, provides a clear roadmap for what to tweak. For example, you might discover that a local shop owner is far more interested in their Google Business Profile clicks than overall keyword visibility. That insight allows you to make a simple but powerful adjustment to their dashboard layout, making it instantly more relevant to them. If you need a refresher on aligning metrics with business goals, our guide on how to measure SEO success is a great resource.
This ongoing process ensures your SEO dashboard for clients remains an essential tool that proves your worth, builds trust, and keeps your clients invested in their SEO journey.
Ready to build dashboards that clients love and use? Discover how That's Rank! can help you create stunning, white-label reports that prove your value 24/7.