In today's data-rich landscape, marketing reports are more than just spreadsheets filled with numbers; they are your strategic compass. They transform raw data into actionable insights, revealing what is working, what is not, and where your biggest opportunities lie. Without a clear reporting framework, you are essentially navigating blind, making decisions based on gut feelings rather than evidence. To overcome data overload and achieve strategic clarity, understanding the transformative role of artificial intelligence in modern marketing is becoming increasingly essential. For those looking to dive deeper into this subject, a comprehensive guide on Künstliche Intelligenz im Marketing offers valuable insights.
This guide moves beyond theory and dives straight into practical application. We will dissect 8 powerful marketing report examples from industry leaders like Google, HubSpot, and Salesforce. For each example, we will break down the strategic thinking behind its structure, showcase the key metrics that matter, and provide you with actionable takeaways and replicable methods.
By the end, you will not only understand how to interpret complex reports but also how to build your own. You will learn to craft compelling narratives with your data, effectively communicate performance to stakeholders, and ultimately use your reports to drive meaningful growth and prove marketing ROI. Let’s explore the examples that turn data into decisions.
1. HubSpot's State of Marketing Report
When it comes to comprehensive, data-driven marketing report examples, HubSpot's annual "State of Marketing Report" sets the industry standard. This isn't just an internal performance review; it's a global analysis that synthesizes survey responses from thousands of marketers with insights from HubSpot's own extensive platform data. The result is a powerful tool for strategic planning, benchmarking, and trend forecasting.
Strategic Analysis and Application
This report excels by providing a macro-level view of the marketing landscape, allowing businesses to validate their strategies against broader industry movements. It answers critical questions about where to allocate budgets, which channels are gaining traction, and what challenges peers are facing. For instance, the 2023 report highlighted the sustained dominance of social media and the explosive growth of video marketing.
Key Strategic Insight: By using this report, marketing leaders can move beyond anecdotal evidence and make budget and resource decisions based on large-scale, verified data. It provides the "why" behind strategic pivots, making it easier to gain buy-in from stakeholders.
The following chart visualizes two critical data points from the report, highlighting where marketer focus and content engagement are heading.
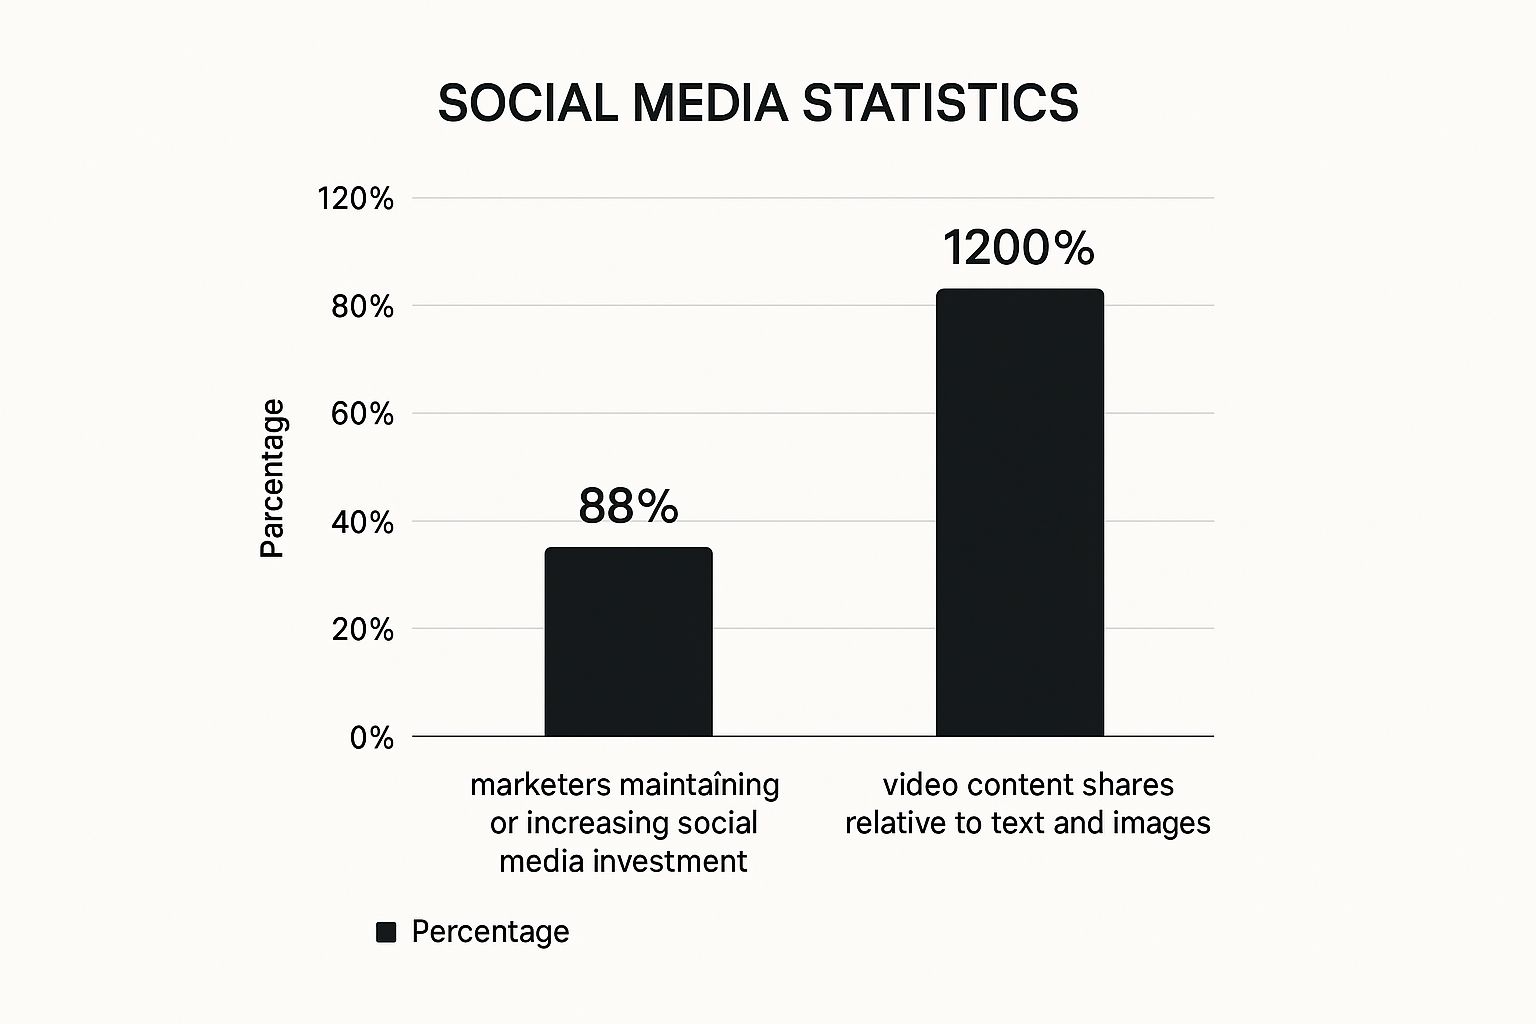
This data clearly illustrates a dual trend: marketers are committed to investing in social media, while video content dramatically outperforms other formats in generating engagement.
Actionable Takeaways for Your Team
- Benchmark Your Budget: Compare your marketing spend against the industry averages reported by HubSpot. Use their data on channel investment to see if you are over-indexing or under-indexing in key areas like social media, SEO, or email marketing.
- Prioritize High-ROI Content: The report consistently proves video's high engagement rates. Use this evidence to justify increasing your investment in video creation for social platforms and your website.
- Inform Your Reporting: Integrate HubSpot's findings into your own reporting to add context. When you create SEO reports, for example, you can benchmark your organic performance against the trends identified in the report.
2. Google's Consumer Insights Report
Where HubSpot offers a view from the marketer's perspective, Google's Consumer Insights Reports provide a direct line into the mind of the consumer. These powerful marketing report examples are built on a foundation of unparalleled data from Google Search, YouTube, and other platforms. They analyze trillions of data points to reveal how consumer behavior is shifting, what motivates purchase decisions, and the critical "micro-moments" that define the modern customer journey.
Strategic Analysis and Application
Google's reports, often published through its "Think with Google" platform, are less about channel performance and more about understanding user intent. They help marketers move from asking "what" to understanding "why." For instance, reports on the "Zero Moment of Truth" fundamentally changed how brands approach the pre-purchase research phase, emphasizing the need for helpful content long before a consumer is ready to buy. Similarly, analysis of COVID-19 search trends provided real-time insights into changing consumer needs.
Key Strategic Insight: By leveraging Google's data, marketers can align their campaigns with actual consumer search behavior, not just assumptions. This approach allows you to identify and win the small, intent-rich moments that ultimately lead to a conversion.
These reports offer a roadmap for content and campaign strategy. Beyond broad consumer trends, you can also dive into specific Google Ads case studies to see how data-driven strategies lead to success in targeted campaigns.
Actionable Takeaways for Your Team
- Map Your Customer Journey: Use the "micro-moments" framework (I-want-to-know, I-want-to-go, I-want-to-do, I-want-to-buy) to audit your content. Do you have assets that effectively answer customer questions at each stage?
- Leverage Google Trends: Don't wait for the annual report. Use Google Trends to monitor emerging topics and seasonal interest relevant to your industry, allowing you to time campaigns for maximum impact.
- Inform Your Keyword Strategy: Move beyond basic keywords. Analyze the questions and long-tail phrases identified in Google's reports to build a more nuanced SEO and content strategy that captures high-intent traffic.
3. Salesforce's State of the Connected Customer Report
While many marketing report examples focus on channel performance, Salesforce's "State of the Connected Customer" report offers a crucial, customer-centric perspective. It dives deep into evolving customer expectations, providing a vital benchmark for how businesses should approach everything from personalization to service. The report synthesizes data from thousands of consumers and business buyers globally, making it an essential tool for aligning marketing efforts with what customers actually want.
Strategic Analysis and Application
This report is powerful because it shifts the focus from internal metrics to external expectations. It helps businesses understand the "why" behind customer behavior, revealing critical gaps between what companies deliver and what customers demand. For instance, the report consistently finds that a vast majority of customers expect companies to understand their unique needs and that being treated like a person is key to winning their business. This insight moves personalization from a "nice-to-have" feature to a core business strategy.
Key Strategic Insight: Use this report to champion a customer-first culture. The data provides undeniable proof that the customer experience is the new battleground for brand loyalty. It gives leaders the ammunition to justify investments in CRM, data analytics, and personalization technologies.
By understanding these evolving expectations, marketers can better design campaigns that resonate on a human level, fostering trust and long-term relationships rather than just short-term conversions.
Actionable Takeaways for Your Team
- Audit Your Customer Experience: Benchmark your current service and personalization efforts against the report's findings. For example, if 73% of customers expect companies to understand their unique needs, how well does your marketing reflect this?
- Segment by Generation: The report often highlights generational differences in communication preferences and technology adoption. Tailor your messaging and channel strategy to connect more effectively with Gen Z, Millennials, and Baby Boomers.
- Inform Your Dashboard Metrics: The qualitative insights from this report can help you choose the right KPIs. Your team can create a marketing dashboard that measures not just leads, but customer satisfaction and personalization engagement.
4. Content Marketing Institute's B2B Content Marketing Report
For B2B marketers, the annual report from the Content Marketing Institute (CMI), often produced in partnership with MarketingProfs, is an indispensable resource. Unlike general marketing reports, this study dives deep into the specific challenges and opportunities within the B2B space. It surveys thousands of B2B marketers to reveal benchmarks, best practices, and evolving trends in content creation, distribution, and measurement.
Strategic Analysis and Application
This report is a strategic blueprint for any B2B content marketing program. It provides clear data on what separates the most successful marketers from the rest, consistently showing that a documented content strategy is a key differentiator. The report helps businesses understand which content formats are most effective for different stages of the funnel, where to allocate spending, and how to structure their teams for success. For example, recent reports have highlighted the rising importance of video and the continued value of in-person events for B2B engagement.
Key Strategic Insight: The CMI report empowers B2B marketing leaders to justify their strategies with peer-validated data. It provides the evidence needed to advocate for a documented strategy, secure budget for specific content types, and adopt the measurement practices of high-performing organizations.
Actionable Takeaways for Your Team
- Prioritize Your Content Calendar: Use the report’s data on content effectiveness to guide your editorial planning. If the data shows video and research reports are driving the best results in your industry, allocate more resources to producing that content over less effective formats.
- Benchmark Your Budget and Team: Compare your content marketing spend as a percentage of your total marketing budget against the industry averages provided. Use the findings on team structure and outsourcing to evaluate if your current setup is optimized for growth.
- Refine Your Measurement Framework: Adopt the KPIs and measurement models used by the most successful B2B marketers identified in the report. This helps you move beyond basic metrics and effectively analyze content performance to demonstrate ROI.
5. Sprout Social's Social Media Index Report
Sprout Social's quarterly "Social Media Index" is one of the most respected marketing report examples focused purely on the social landscape. It masterfully combines consumer survey data with large-scale social media analytics to reveal how user behavior is evolving. This report moves beyond vanity metrics to dissect what truly drives engagement, consumer trust, and brand loyalty on social platforms.
Strategic Analysis and Application
This report is essential for any marketing team looking to refine its social media strategy with precision. It offers benchmarks for critical performance indicators like response times and audience sentiment, allowing brands to measure their efforts against real-world expectations. For instance, past indexes have shown that brands responding within an hour see markedly higher customer satisfaction, while an authentic voice can boost engagement by over 20% compared to a sterile corporate tone.
Key Strategic Insight: This report gives social media managers the data needed to advocate for resources. It translates abstract concepts like "brand voice" and "customer care" into tangible KPIs, demonstrating their direct impact on business outcomes and customer retention.
While comprehensive tools like Sprout Social offer broad insights, focusing on specific platforms is also crucial. For example, you can learn more about how to approach mastering Pinterest analytics to uncover specific trends and performance metrics on that platform. This specialized focus complements the wider view provided by the Index.
Actionable Takeaways for Your Team
- Set Customer Service Benchmarks: Use the report’s findings on consumer expectations for response times to establish clear SLAs for your social media and community management teams.
- Refine Your Brand Voice: Analyze the data on what content styles resonate most with audiences. Use this to guide your creative team in developing a more authentic, human-centric voice that fosters connection.
- Adapt Platform-Specific Strategies: The Index often breaks down trends by platform. Use these insights to tailor your content, ensuring you’re creating what works best for Instagram, X (formerly Twitter), TikTok, and other key channels.
6. Mailchimp's Email Marketing Benchmarks Report
For any business leveraging email, Mailchimp's annual Email Marketing Benchmarks Report is an indispensable resource. This isn't just another set of generic statistics; it's a deep-dive analysis derived from billions of emails sent across its vast platform. The report meticulously breaks down key performance indicators like open rates, click-through rates, and bounce rates by industry, audience size, and region, providing a granular look at what success looks like in different contexts.

This level of detail makes it one of the most practical marketing report examples available for setting realistic and informed performance goals.
Strategic Analysis and Application
The primary value of Mailchimp's report is its ability to ground your email marketing strategy in reality. It helps you move past vanity metrics and understand your performance relative to your specific industry peers. For example, knowing the average e-commerce click rate is 2.01% allows you to set achievable targets, while seeing that government-related emails achieve a 28.77% open rate highlights the importance of audience trust and relevance.
Key Strategic Insight: By using these benchmarks, you can diagnose performance issues with surgical precision. If your open rates are far below your industry average, the problem is likely your subject lines or sender reputation. If open rates are strong but click-through rates are low, the issue lies within your email copy, call-to-action, or offer.
This report transforms performance reviews from a guessing game into a data-driven diagnostic process, enabling teams to focus their optimization efforts where they will have the most impact.
Actionable Takeaways for Your Team
- Set Realistic KPIs: Use the latest Mailchimp report to establish your email marketing goals. If you're in the retail sector, don't aim for the open rates seen in the non-profit industry. Set targets that are slightly above your industry's average to drive meaningful but achievable growth.
- Segment and Compare: Don't just look at the overall industry average. If your business serves multiple sectors, segment your audience and compare the performance of each segment against its relevant benchmark. This can reveal which audiences are most engaged and where opportunities lie.
- Justify Resource Allocation: Use the data to make a case for investing in specific areas. If your click rates are lagging, use the report's benchmarks to justify allocating time and resources to A/B testing different calls-to-action, email designs, and promotional offers.
7. Edelman Trust Barometer Marketing Report
While not a traditional performance dashboard, the annual Edelman Trust Barometer is one of the most vital marketing report examples for understanding the foundational element of all consumer relationships: trust. This global study examines public trust in institutions, including businesses, media, and governments. Its findings provide crucial context for brand messaging, reputation management, and strategic communications.
Strategic Analysis and Application
This report is essential for marketers aiming to build authentic, resilient brands. It moves beyond campaign metrics to analyze the psychological factors that drive consumer loyalty and purchase decisions. For example, the report consistently reveals which sources consumers find most credible, showing that technical experts and fellow employees often carry more weight than CEOs or celebrity spokespeople. This directly informs who should be the face of your brand.
Key Strategic Insight: By analyzing the Trust Barometer, marketers can align their communication strategies with prevailing societal sentiments. This allows brands to build equity by communicating on the right channels, through the most trusted voices, and on topics that consumers genuinely care about.
The data provides a roadmap for earning, not just demanding, consumer attention. It highlights that actions like treating employees well and having ethical business practices are now powerful marketing differentiators that build long-term trust and loyalty.
Actionable Takeaways for Your Team
- Rethink Your Brand Spokespeople: Use the report’s data on trusted voices to guide your influencer and advocacy programs. Prioritize collaborations with credible technical experts or empower your own employees to become brand ambassadors.
- Strengthen Your Crisis Communications: The report offers insights into how trust is lost and regained. Incorporate these findings into your crisis communication plan to ensure your response is perceived as authentic and effective.
- Inform Your ESG and Purpose-Driven Messaging: Leverage the data to understand consumer expectations around a brand's societal role. This helps shape your Environmental, Social, and Governance (ESG) initiatives and ensures your purpose-driven marketing resonates.
8. Facebook IQ (Meta) Marketing Insights Report
For marketers heavily invested in the social media ecosystem, the reports from Facebook IQ, now part of Meta for Business, are indispensable. These are not simple performance dashboards; they are deep, research-driven analyses combining Meta's massive internal data pool with external studies. The reports dissect consumer behavior, advertising effectiveness, and platform-specific trends across Facebook, Instagram, and WhatsApp, offering a goldmine of strategic intelligence.
Strategic Analysis and Application
These reports provide a direct line into the behavioral patterns of billions of global users, helping marketers understand not just what works, but why it works on Meta's platforms. They answer crucial questions about evolving consumer journeys, the impact of different ad formats, and the rise of new behaviors like social commerce. For example, reports have revealed that 70% of shoppers turn to Instagram for product discovery, fundamentally changing how brands should approach the platform.
Key Strategic Insight: By leveraging Meta's reports, marketers can build platform-native strategies rather than applying a one-size-fits-all approach. These insights allow teams to optimize creative, targeting, and user experience based on how people actually use the apps, maximizing ad spend and engagement.
This video from Meta for Business explores how to build effective mobile-first video ads, a recurring theme in their insight reports.
The insights from such analyses are critical for anyone creating paid or organic content for the Meta family of apps.
Actionable Takeaways for Your Team
- Adopt Video Best Practices: Meta's research consistently shows that mobile-first video ads with captions significantly outperform those without. Implement their creative guidelines, such as designing for sound-off viewing and capturing attention in the first three seconds, to boost view time and engagement.
- Develop a Social Commerce Strategy: Use the data on how consumers discover and buy products to build a robust Facebook and Instagram Shops strategy. Tag products in posts and Stories to create a seamless path from discovery to purchase.
- Inform Your Reporting with Platform Data: When you present your social media marketing report examples to stakeholders, use Meta's findings to add powerful context. Justifying a budget increase for Instagram Stories ads is much easier when backed by Meta's data on user engagement in that format.
Marketing Report Key Insights Comparison
| Report Title | 🔄 Implementation Complexity | ⚡ Resource Requirements | 📊 Expected Outcomes | 💡 Ideal Use Cases | ⭐ Key Advantages |
|---|---|---|---|---|---|
| HubSpot's State of Marketing Report | Moderate: Annual survey & platform data analysis | Moderate: Large survey + platform data | Industry benchmarks, trend predictions | Benchmarking marketing strategies, budget planning | Large sample size, actionable strategic insights |
| Google's Consumer Insights Report | High: Real-time, multi-source data integration | High: Access to extensive ecosystem data | Consumer journey insights, micro-moment trends | Campaign timing, customer journey optimization | Real-time insights, cross-platform consumer data |
| Salesforce's State of the Connected Customer | Moderate-High: Multi-generational surveys plus platform data | Moderate: Customer surveys and CRM data | Customer expectation benchmarks, CX improvement | Customer experience enhancement, personalization | Deep customer psychology insights, actionable CX |
| Content Marketing Institute's B2B Report | Moderate: Annual B2B marketer surveys | Moderate: Survey data and content analysis | Content strategy effectiveness and ROI benchmarks | B2B content strategy, performance benchmarking | B2B-specific detailed data, practical benchmarks |
| Sprout Social's Social Media Index Report | Moderate: Quarterly analytics + consumer surveys | Moderate: Social media analytics and surveys | Social media trends, engagement & crisis metrics | Social media strategy, crisis management | Timely updates, platform-specific actionable data |
| Mailchimp's Email Marketing Benchmarks | Low-Moderate: Platform email data aggregation | Moderate: Platform analytics processing | Industry open & click rate benchmarks | Email marketing optimization, industry comparison | Huge dataset, industry-specific detailed metrics |
| Edelman Trust Barometer Marketing Report | Moderate: Global consumer & stakeholder surveys | Moderate: Long-term survey data | Trust and communication impact on brand loyalty | Brand building, crisis communication strategies | Global, peer-reviewed, trust-focused insights |
| Facebook IQ (Meta) Marketing Insights Report | Moderate-High: Internal data + external research | High: Meta platform analytics + commissioned studies | Social commerce, video & mobile marketing insights | Social commerce, digital ad optimization | Access to Meta’s ecosystem, social commerce focus |
Turning Insights into Impact: Your Next Steps
We've explored a diverse landscape of powerful marketing report examples, from HubSpot's comprehensive industry analysis to Mailchimp's granular email benchmarks. Each one serves as more than just a collection of data; they are strategic roadmaps, revealing the patterns, preferences, and behaviors that define modern consumer engagement. The journey through these reports, whether it's understanding B2B content trends from the Content Marketing Institute or gauging consumer trust with the Edelman Trust Barometer, illuminates a core truth: successful marketing is not built on guesswork. It is built on a foundation of clear, actionable data.
The true value of these examples lies not in passive reading but in active application. The ultimate goal is to move from simply consuming insights to creating impact. Your marketing strategy deserves the same level of analytical rigor and clarity demonstrated in these industry-leading reports. By adopting their frameworks, you can transform your raw performance data into a compelling narrative that guides decisions, secures buy-in from stakeholders, and drives measurable growth.
Synthesizing the Core Lessons
Reflecting on the marketing report examples we've analyzed, several key themes emerge as critical for success:
- Context is King: A metric without context is just a number. As seen in Sprout Social's Index, comparing your social media engagement to industry benchmarks provides the necessary context to understand if your performance is strong, average, or in need of improvement.
- Audience-Centricity is Non-Negotiable: Reports like Salesforce's State of the Connected Customer and Meta's Facebook IQ constantly remind us to place the customer at the center of our universe. Effective reports are those that translate data into a deeper understanding of audience needs and expectations.
- Actionability Over Volume: A 50-page report is useless if it doesn't lead to a decision. The best reports distill complex information into a few key takeaways and recommended actions. Your own reporting should prioritize clarity and direct next steps.
Your Action Plan for Data-Driven Marketing
So, where do you go from here? The path from inspiration to implementation can be broken down into a few manageable steps. This is how you can begin building a more resilient and effective marketing engine, using the principles from the marketing report examples we've covered.
- Identify Your Primary Goal: Start by asking what your most pressing marketing question is. Are you trying to improve customer retention? Increase organic traffic? Optimize ad spend? Your primary goal will determine which type of report is most relevant to you right now.
- Select a Relevant Framework: Use the examples in this article as a template. If you're focused on SEO and content, model your report after the structure of the Content Marketing Institute's report, focusing on performance, gaps, and opportunities. If you're refining your customer journey, Salesforce's framework is an excellent starting point.
- Build Your Custom Dashboard: The next step is to consolidate your data. Instead of jumping between Google Analytics, your email platform, and social media analytics, create a unified dashboard. This "single source of truth" is essential for seeing the big picture and connecting the dots between different channels.
By consistently creating, analyzing, and acting on data-driven reports, you transform marketing from a set of isolated activities into an integrated, strategic function that delivers predictable and profitable results.
Ready to stop juggling dozens of tabs and start building powerful, consolidated SEO reports? That's Rank provides an all-in-one toolkit to track your keyword rankings, monitor competitors, and analyze site performance in one clean dashboard. Turn your SEO data into actionable insights and build reports that drive real impact by visiting That's Rank today.