To get your page loading faster, you really need to focus on three key areas: optimizing your images, cleaning up your code, and using caching effectively. Think of these as the three legs of a stool—get them all right, and you'll create a stable, fast experience for everyone who visits your site. It all comes down to sending less data and helping the browser process it quicker.
Why Your Page Load Speed Is a Game-Changer
Before we jump into the "how," let's talk about the "why." A slow website isn't just a minor inconvenience; it's a direct threat to your business goals. Seriously. Every fraction of a second you can trim from your load time can lead to real, measurable improvements in how people engage with your site, how high you rank in search, and ultimately, how much revenue you bring in.
You've only got a few seconds to make a good first impression. If a visitor lands on your page and is met with a blank screen, they're gone. We've all done it. This isn't just a hunch; it's a cold, hard fact reflected in a metric we all dread: the bounce rate.
The Link Between Slow Speeds and Lost Visitors
Slow load times are pure friction. That friction translates directly into people leaving your site (higher bounce rates), spending less time on it, and buying less from you. This is especially true on mobile, where patience is even thinner.
Consider this: one deep-dive analysis of top global sites revealed the average mobile page takes a whopping 8.6 seconds to load. Compare that to the 2.5-second average on a desktop. It's no surprise, then, that the mobile bounce rate is 56.8%. People just won't wait around on their phones.
How User Frustration Impacts Your Google Rankings
Google's whole game these days is about user experience. That's where metrics like the Google Core Web Vitals come in. These aren't just technical jargon; they're specific signals Google uses to judge whether your site provides a good experience.
The big ones you'll hear about are:
- Largest Contentful Paint (LCP): This measures how quickly the main event on your page—like a big banner image or the first block of text—shows up.
- Time to First Byte (TTFB): This is how long it takes for the browser to get the very first piece of data back from your server. It’s a gut check for your server's responsiveness.
If these numbers are bad, you're basically telling Google your site is frustrating to use, which can tank your search rankings. If you want to get into the nitty-gritty of these, we have a whole guide explaining what Core Web Vitals are.
The bottom line: A faster website isn't a "nice-to-have." It's essential for keeping visitors on your site, turning them into customers, and earning those top spots in Google.
When you start digging into your site's performance, you'll encounter a few key metrics over and over. This table gives a quick rundown of what they are and why they matter.
Key Page Speed Metrics at a Glance
| Metric | What It Measures | Why It's Important |
|---|---|---|
| LCP | Time until the largest page element is visible. | Signals to the user that the main content has loaded. |
| TTFB | Time for the server to send the first byte of data. | A high TTFB points to server or backend issues. |
| FCP | Time until the first piece of content appears. | Shows the user that the page is actually working and loading. |
| Speed Index | How quickly the content of a page is visibly populated. | Measures the perceived load speed, not just a single technical point. |
| Total Blocking Time | Time the page is blocked from responding to user input. | Directly impacts interactivity and can make a page feel sluggish. |
Understanding these terms is the first step. They are the language of speed optimization, and you'll see them pop up in diagnostic tools.
Speaking of tools, something like Google's PageSpeed Insights gives you an immediate, visual snapshot of where you stand.

A dashboard like this is invaluable. It doesn't just give you a score; it points out exactly what's slowing you down, giving you a clear, actionable to-do list for making improvements.
Using Diagnostic Tools to Pinpoint Speed Bottlenecks
You can't fix a problem you can't see. When it comes to page speed, moving from that vague feeling of "my site is slow" to a precise diagnosis is the first real step toward a solution. This means getting your hands dirty with diagnostic tools to find the exact culprits—whether it's a massive hero image, a clunky script, or a sluggish server—that are creating performance bottlenecks.
This is where tools like Google PageSpeed Insights, GTmetrix, and WebPageTest become your best friends. They do more than just spit out a grade; they give you a detailed report card and a list of specific, actionable recommendations. My advice? Don't get overwhelmed by all the data. Zero in on the big-ticket items they flag first.
Interpreting Your Speed Test Results
Once you run a test, you'll be staring at a lot of information. The most valuable part, in my experience, is the waterfall chart. It gives you a visual breakdown of how every single asset on your page loads, one after the other. It’s the perfect way to spot the files that are dragging everything else down.
For instance, you might see a really long, dark bar next to hero-banner.jpg. That’s a dead giveaway that your main banner image is way too big and is holding up the entire show. Or, you might notice a bunch of JavaScript files from third-party plugins creating a traffic jam at the top of the chart. This visual proof turns a vague problem into a concrete task.
A common flag you’ll run into is "Reduce initial server response time." This points directly to your Time to First Byte (TTFB). It’s the tool’s way of telling you the problem isn't the files on your page, but the server itself taking too long to even answer the door. This insight steers you toward looking at your hosting plan or backend code, not just front-end tweaks.
Understanding performance also means having a frame of reference. Average website page load times can vary quite a bit depending on the device and location. Data from Google shows that in the US, the largest content on a page takes about 1.9 seconds to load on mobile and 1.7 seconds on desktop. Knowing these benchmarks helps you set realistic goals and shows how even small improvements can make a huge impact.
This simple workflow visualizes the core process of identifying and fixing speed issues.
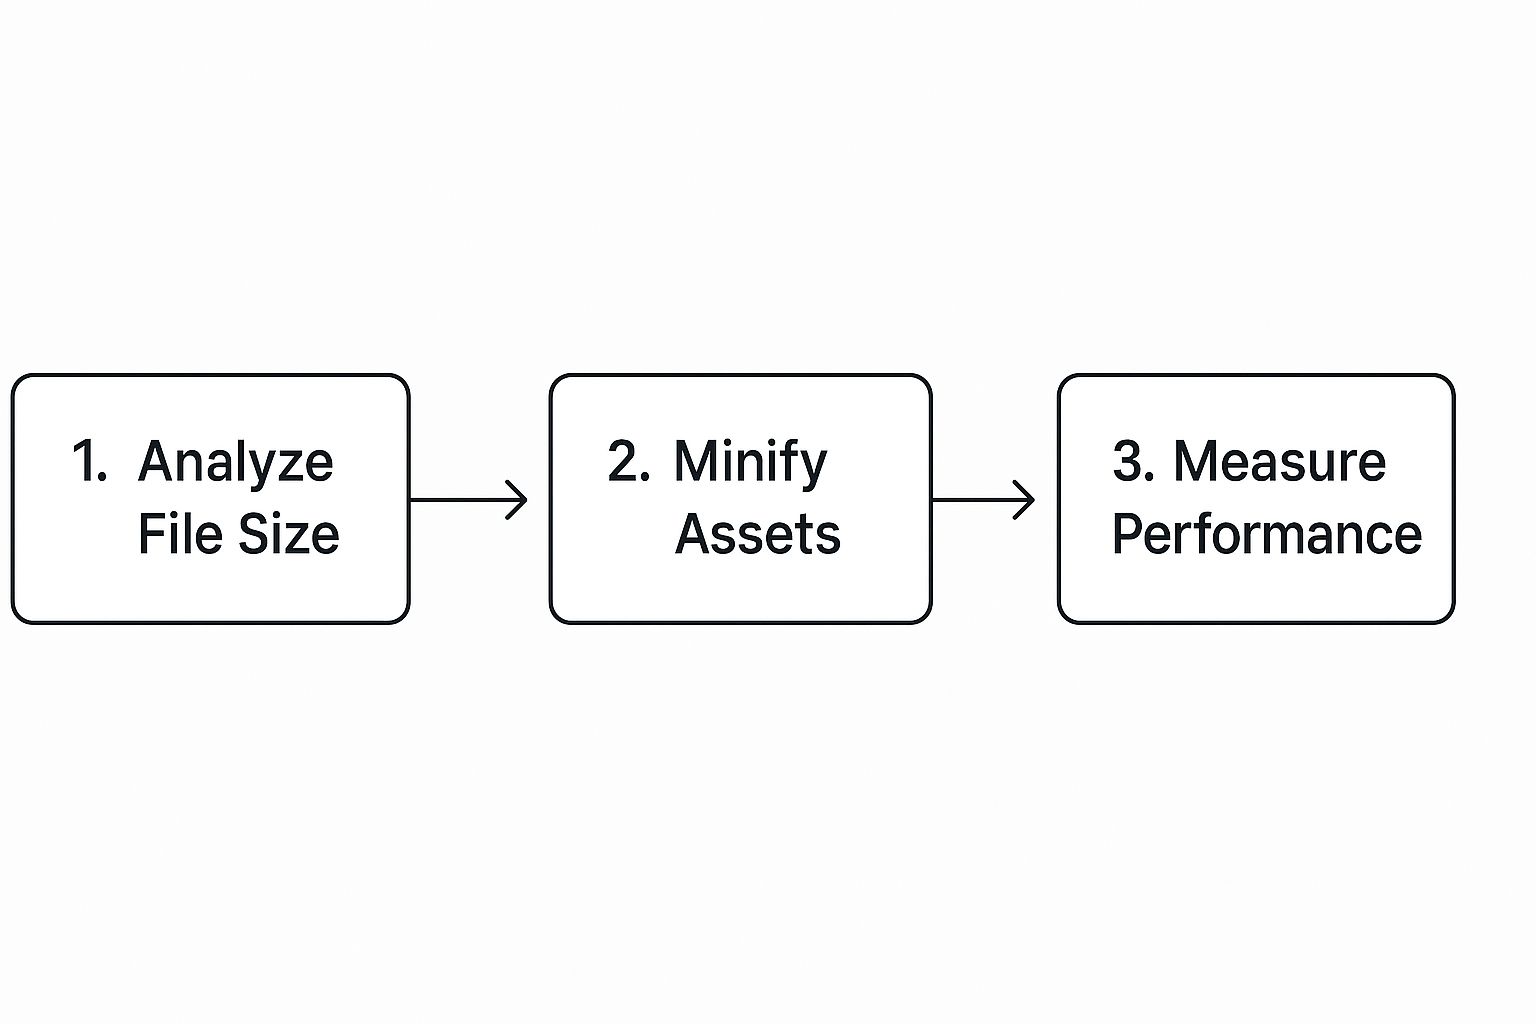
As you can see, the process is cyclical: analyze your assets, apply optimizations like minification, and then measure again to see what worked.
From Diagnosis to Action
Once you’ve identified the culprits in your speed report, you can start making targeted fixes. The trick is to match the problem with the right solution.
- Large Images: If your waterfall chart is screaming about massive image files, your next move is image compression and resizing.
- Too Many Requests: Seeing dozens of small CSS or JavaScript files? It’s time to look into minification and combining them into fewer files.
- Slow External Scripts: If a third-party script for something like a social media feed is lagging, you should figure out how to defer its loading so it doesn't block more important content.
These tools are crucial for the initial diagnosis, but they’re just as important for tracking your progress. Before you start making changes, it’s also a good idea to have a complete map of your site's structure. You can learn more about how to crawl a website to get a full picture of all its pages and resources.
After you implement a fix, run the test again. Seeing your scores jump up and those load times drop is the best confirmation that your hard work is paying off.
Optimizing Images and Media Without Sacrificing Quality
If your site is struggling with slow load times, chances are high that large, unoptimized media files are the main culprit. I’ve seen it time and time again: beautiful, high-resolution images and videos that look great but act like an anchor, dragging down performance. The good news is you don't have to choose between a visually stunning site and a fast one. It's all about working smarter, not harder, with your media files.
Start with Modern File Formats
Your first move should be to evaluate the file formats you're using. For years, JPEG was the go-to for photos, and for good reason. It offered a solid balance of quality and compression. But technology has moved on, and so should we.
Modern formats like WebP and AVIF are game-changers. They can dramatically shrink file sizes while maintaining—and sometimes even improving—visual quality compared to their older counterparts. Making the switch is one of the highest-impact changes you can make to improve page load speed.
I've seen clients reduce their image file sizes by 25-35% just by converting from JPEG to WebP, with absolutely no visible difference in quality. When you apply that across an entire website, your Largest Contentful Paint (LCP) score will thank you.
Compress Images Intelligently
After picking the right format, your next step is compression. This isn't about making your images blurry or pixelated; it's a process that cleverly strips out hidden, unnecessary data from the file to make it smaller.
While you could use Photoshop’s "Save for Web" feature, I've found that dedicated online tools are often more efficient and yield better results. They are built for one purpose, and they do it exceptionally well.
Tools like TinyPNG or ImageOptim are fantastic because they make "lossy" compression simple. You just upload your image, and their algorithms work their magic, striking that perfect balance between a tiny file size and a crisp, clear image.
Here's what the TinyPNG interface looks like. It’s a tool I recommend to clients all the time for its sheer simplicity and effectiveness.

As you can see, you just drag your files in, and the tool does the rest. It even shows you how much space you've saved. A 70% reduction is not uncommon, and that kind of saving has a massive, immediate impact on load time.
Deliver a Responsive and Lazy-Loaded Experience
Great optimization goes beyond just file size. It’s also about serving the right image to the right user. Think about it: someone on a huge 4K desktop monitor needs a much different image than someone scrolling on a small smartphone. Forcing a phone to download a giant desktop-sized image is a huge waste of data and a primary cause of slow mobile experiences.
This is where responsive images, using the srcset attribute in HTML, become your best friend. It lets you give the browser a menu of image sizes to choose from. The browser is smart enough to pick the most efficient one based on the user's screen size and resolution.
Finally, you absolutely need to implement lazy loading. This simple but powerful technique instructs the browser to wait to load images and videos until the user is about to scroll them into view. By not loading everything at once, the initial page appears to load almost instantly, giving your visitors a much better first impression. Most modern CMS platforms like WordPress offer plugins or built-in features that let you enable this with a single click.
Streamline Your Code: Minification, Deferral, and Async Loading
Beyond just images, the very code that builds your website—your HTML, CSS, and JavaScript—can be a major drag on performance. Think of your site's code as the blueprint the browser reads to construct your page. If that blueprint is cluttered with extra notes, comments, and unnecessary spacing, it slows the whole construction process down.
That’s where a couple of powerful techniques, minification and deferral, can make a world of difference.
Minification is essentially a digital clean-up. It strips out all the non-essential characters from your code files without breaking anything. This means removing white space, line breaks, and developer comments that, while helpful for humans, are just dead weight to a browser trying to render your page.
Thankfully, you don't need to do this by hand. Most modern performance or caching plugins, like WP Rocket for WordPress, have a simple one-click option to minify your CSS and JavaScript files. It’s one of the easiest wins you can get for your site speed.
Prioritize What Users See First with Deferral and Async
Even more impactful than trimming down your code is changing how it loads. By default, when a browser hits a JavaScript file, it stops everything else—like displaying text and images—to download and run that script. This is called render-blocking, and it's a notorious performance bottleneck.
It's like trying to read a newspaper, but being forced to wait for all the ads to finish printing before you can even see the front-page headline. It’s a frustrating and completely avoidable delay for your visitors.
By deferring non-critical scripts, you're telling the browser: "Go ahead and show the user all the important visual content first. You can load these other things in the background once the main page is ready."
This simple change dramatically improves what we call perceived performance. The user sees the content they came for almost instantly, making the site feel much faster, even if other things are still loading in the background.
You can accomplish this in two main ways:
defer: This attribute tells the browser to download the script along with everything else but to hold off on running it until the main HTML document is fully understood.async: This attribute lets the browser download and run the script in the background, completely independent of the page rendering process.
Which Scripts Are Safe to Defer?
So, what can you safely push to the back of the line? It can feel a bit technical, but the guiding principle is simple: if a script isn't absolutely necessary to display the content a user sees when they first land on the page (the "above-the-fold" content), it's a perfect candidate for deferral.
You'll often get the biggest boost by delaying third-party scripts that add features but aren't core to your site's immediate function.
Common scripts that are great candidates for defer or async include:
- Social media sharing buttons or feed widgets (from Facebook, X/Twitter, etc.)
- Live chat pop-ups
- Analytics and marketing trackers
- Third-party comment systems
By putting these code optimization strategies to work, you direct the browser's attention to what really matters: getting your content in front of your visitor as quickly as possible.
Cut Down Data Travel Time with Caching and a CDN

Once your code and images are in good shape, the next big win comes from reducing the physical distance your data has to travel. This is where two incredibly powerful tools come into play: browser caching and a Content Delivery Network (CDN).
Think of browser caching like this: when someone visits your site, their browser "remembers" parts of it. It saves static files—like your logo, CSS stylesheets, and fonts—right on their device. The next time they visit, their browser doesn't have to fetch all that stuff again from your server. The page just snaps into view. It’s a game-changer for repeat visitors.
For most websites, setting this up is easier than you'd think. If you’re using WordPress, for example, a solid performance plugin can handle the heavy lifting and configure the right caching policies with just a few clicks. You can dive deeper into the specifics in our complete guide to page speed optimization.
Use a CDN to Go Global, Instantly
Browser caching is fantastic for repeat visitors, but what about everyone else? A Content Delivery Network, or CDN, speeds things up for all your users, especially first-timers and people located far away from your web server.
A CDN is essentially a network of servers spread across the globe, and each one holds a copy of your site's static files.
It's like having one popular coffee shop. If customers have to travel from all over the world, the journey is slow and the lines get long. A CDN is like franchising that shop, putting a local branch in every major city. Now, customers get their coffee instantly from the closest location.
This setup drastically cuts down on latency, which is the technical term for the time it takes data to travel from point A to point B. Instead of a visitor in London waiting for files to arrive from a server in Los Angeles, they get them from a server right there in London. The difference is night and day.
This strategy of pre-positioning content is incredibly effective. For instance, Facebook saw mobile page loads speed up by as much as 25% just by prefetching and caching content it predicted users would click on. While you might not have Facebook's resources, the core principle is the same: get your content closer to the user. You can read more about these predictive loading techniques and the impact they have.
How to Get Started with a CDN
Getting a CDN up and running is far more accessible and affordable than most people realize. Many of the best providers have generous free plans that are more than enough for small businesses, personal sites, and blogs.
Here are a couple of popular CDN providers that offer free plans to get you started:
- Cloudflare: A crowd favorite for a reason. It's known for its incredibly simple setup, powerful CDN, and a suite of security features that come with it.
- Bunny.net: This one uses a pay-as-you-go model that is super affordable, making it a great choice for smaller sites that are just starting to grow.
The setup process usually involves signing up for an account and then updating your website's nameserver settings. It's a task that often takes less than an hour but delivers immediate, tangible speed improvements for your entire global audience.
Frequently Asked Page Speed Questions
As you start digging into how to improve your page load speed, a few questions always seem to surface. It's totally normal. Getting these sorted out early on helps you cut through the noise and focus on what really moves the needle. Let's walk through some of the most common ones I hear.
What Optimizations Have the Biggest Impact First?
When a speed tool spits out a giant list of "recommendations," it's easy to feel overwhelmed. Where do you even begin? In my experience, you can get the biggest bang for your buck by focusing on three areas right out of the gate.
- Image Optimization: This is the big one. Seriously. More often than not, the primary culprit for a slow page is oversized, uncompressed images. Compressing your images is non-negotiable. You should also be converting them to modern formats like WebP and implementing lazy loading. This alone will give you a massive, noticeable performance boost.
- Using a CDN: Your next best friend is a Content Delivery Network. A CDN takes your site's files (like images and scripts) and distributes them across servers all over the world. This drastically cuts down the time it takes for your site to load for users, no matter where they are. Setting up a free plan from a service like Cloudflare can take less than an hour and make a world of difference.
- Enabling Caching: Caching, both on the browser and server side, is absolutely essential. It basically creates a "fast lane" for your visitors by storing a temporary copy of your site. This means returning visitors get a super-fast experience, and your server doesn't have to work as hard. Most good hosting providers and performance plugins make this incredibly simple to set up.
If you tackle these three pillars first, you'll solve the vast majority of common speed problems before you ever need to touch a line of code.
How Often Should I Test My Page Speed?
Testing your page speed isn't something you do once and forget about. Think of it more like checking the oil in your car—it’s a regular maintenance task that helps you catch small issues before they become major headaches.
A good rhythm I've found is to run a speed test:
- After any major site change. Did you just install a new plugin, switch themes, or add a feature like a live chat widget? Test it.
- On a regular schedule. At a bare minimum, checking in once a month is a solid baseline. This helps you spot any slow performance creep you might not notice day-to-day.
- When you publish media-heavy content. Just launched a new landing page with a ton of high-res photos or a big video? Test that specific page right away to make sure it’s up to snuff.
Remember, a single test is just a snapshot in time. Consistent monitoring is what tells the real story of your site’s performance and keeps you ahead of the game.
Do I Need a Developer to Make These Changes?
This is probably the question I get asked the most, and I have good news: for most of the high-impact changes, you do not need a developer.
It wasn't always this way. Years ago, speed optimization was a pretty technical affair. But today, the tools available have made it much more accessible for everyone.
- Plugins and Tools: For platforms like WordPress, there are incredibly powerful plugins that can handle image compression, minification, caching, and lazy loading with just a few clicks.
- CDN Setup: Most CDN providers have designed their onboarding to be super straightforward. Often, it's as simple as changing a single setting with your domain registrar.
- Image Compression: Online tools like TinyPNG are literally as easy as dragging and dropping your files.
Sure, a developer can be a huge help with more advanced tasks like optimizing complex database queries or refactoring clunky JavaScript. But the foundational tasks that deliver 80% of the results are completely within reach for the average website owner.
Ready to stop guessing and start measuring? The That's Rank dashboard gives you a complete picture of your site's health, tracks your keyword rankings, and shows you exactly where your competitors are beating you. Take control of your SEO with actionable data. Find out more at thatisrank.com.